Choosing the Best BI Dashboard Software for Your Needs in 2025
Explore key factors in choosing the right BI dashboard software in 2025, including features, pricing, and recommendations for different business sizes.

Looking for the best BI dashboard software? Here's a quick guide to help you decide. Business Intelligence (BI) tools transform data into actionable insights, and in 2025, top options include Tableau, Power BI, and Looker. Each has unique strengths, so choosing the right one depends on your needs.
Key Features to Consider:
- Integration: How well does it connect with your systems?
- Scalability: Can it grow with your business?
- Cost: Does it fit your budget?
- Ease of Use: Is it user-friendly for your team?
- Customization: Can it create tailored reports?
Quick Comparison:
| Software | Starting Cost | Key Strengths | Free Option? |
|---|---|---|---|
| Tableau | $70/user/month | Advanced visualizations, AI tools | Yes (Public) |
| Power BI | $10/user/month | Microsoft integration, affordability | Yes |
| Looker | Custom pricing (e.g., $66,600/year) | Data modeling, SQL workflows | No |
Recommendations:
- Large Enterprises: Tableau for advanced analytics and security.
- Mid-sized Companies: Tableau for scalability and robust features.
- Small Businesses: Power BI for affordability and easy integration.
- Freelancers: Power BI for simplicity and cost-effectiveness.
Each tool offers unique benefits, so consider your organization's size, budget, and data needs.
Looker Studio vs Power BI vs Tableau: Which Analytics Tool is ...

1. Tableau Features
Let’s look at how Tableau performs in terms of integration, scalability, cost, ease of use, and customization. Tableau is designed to handle complex datasets and create user-friendly visualizations. Its VizQL technology translates drag-and-drop actions into SQL queries, enabling interactive visualizations without requiring any coding skills.
Key Features
Tableau includes AI-powered tools that simplify data analysis:
- Explain Data: Uses AI to highlight trends and identify anomalies.
- Data Stories: Automatically generates plain-language summaries for dashboards.
For large-scale enterprise use, Tableau offers robust data management solutions:
- Tableau Catalog and Hyper: Handle indexed data management and provide real-time analytics.
- Slack Integration: Allows real-time updates and dashboard sharing.
"Tableau empowers the whole organization. It brings advanced analytics into the hands of people who don't necessarily have an analyst's or programmer's skill set."
- Alexs Thompson, PhD and Data Scientist at Hallmark Cards
Pricing Overview
| User Role | Standard Price* | Enterprise Price* | Features Include |
|---|---|---|---|
| Creator | $75/user/month | $161/user/month | Tableau Desktop, Prep Builder, Tableau Pulse |
| Explorer | $42/user/month | $98/user/month | Tableau Pulse, Cloud or Server license |
| Viewer | $15/user/month | $49/user/month | Tableau Pulse, basic dashboard access |
*Prices are billed annually.
Advanced Analytics Compatibility
Tableau supports native connections to R and Python, making it a great choice for advanced analytics. Additionally, its Exchange offers pre-built accelerators and extensions to enhance functionality.
Up next, we’ll dive into Power BI’s features and see how it stacks up in terms of integration, cost, and ease of use.
2. Power BI Features
Power BI is a go-to platform for data analysis, with 97% of Fortune 500 companies using it for business intelligence needs. It connects seamlessly with various sources, including cloud services like Azure, Salesforce, and Google Analytics; databases such as SQL Server, Oracle, and Azure Synapse; file formats like Excel and CSV; and enterprise systems like SharePoint and Microsoft 365.
The platform integrates AI tools like text analytics, image recognition, and Copilot, and works alongside Azure ML. It also includes features like sensitivity labels, data loss prevention, and governance tools to safeguard confidential information.
| Plan Type | Monthly Cost | Key Features |
|---|---|---|
| Power BI Pro | $14.00 (billed annually) | Analytics & sharing |
| Power BI Premium Per User | $24.00 (billed annually) | Advanced analytics & larger volumes |
A Forrester study highlighted impressive results for Power BI Pro: 321% ROI over three years, under six months to break even, and $38.5 million in benefits.
"Power BI had a clear advantage over other tools in terms of interoperability with the Microsoft 365 platform. We face no obstacles in getting data to the right place."
- Lars Hesse, Data Analyst, E.ON Energie Deutschland GmbH
The platform can handle tens of millions of rows, with frequent updates and deployment pipelines ensuring faster feature rollouts and accurate publishing.
With its secure, AI-powered analytics and tight integration with Microsoft products, Power BI offers a fast return on investment. Up next, we’ll dive into Looker’s data-modeling capabilities and how they measure up.
3. Looker Features
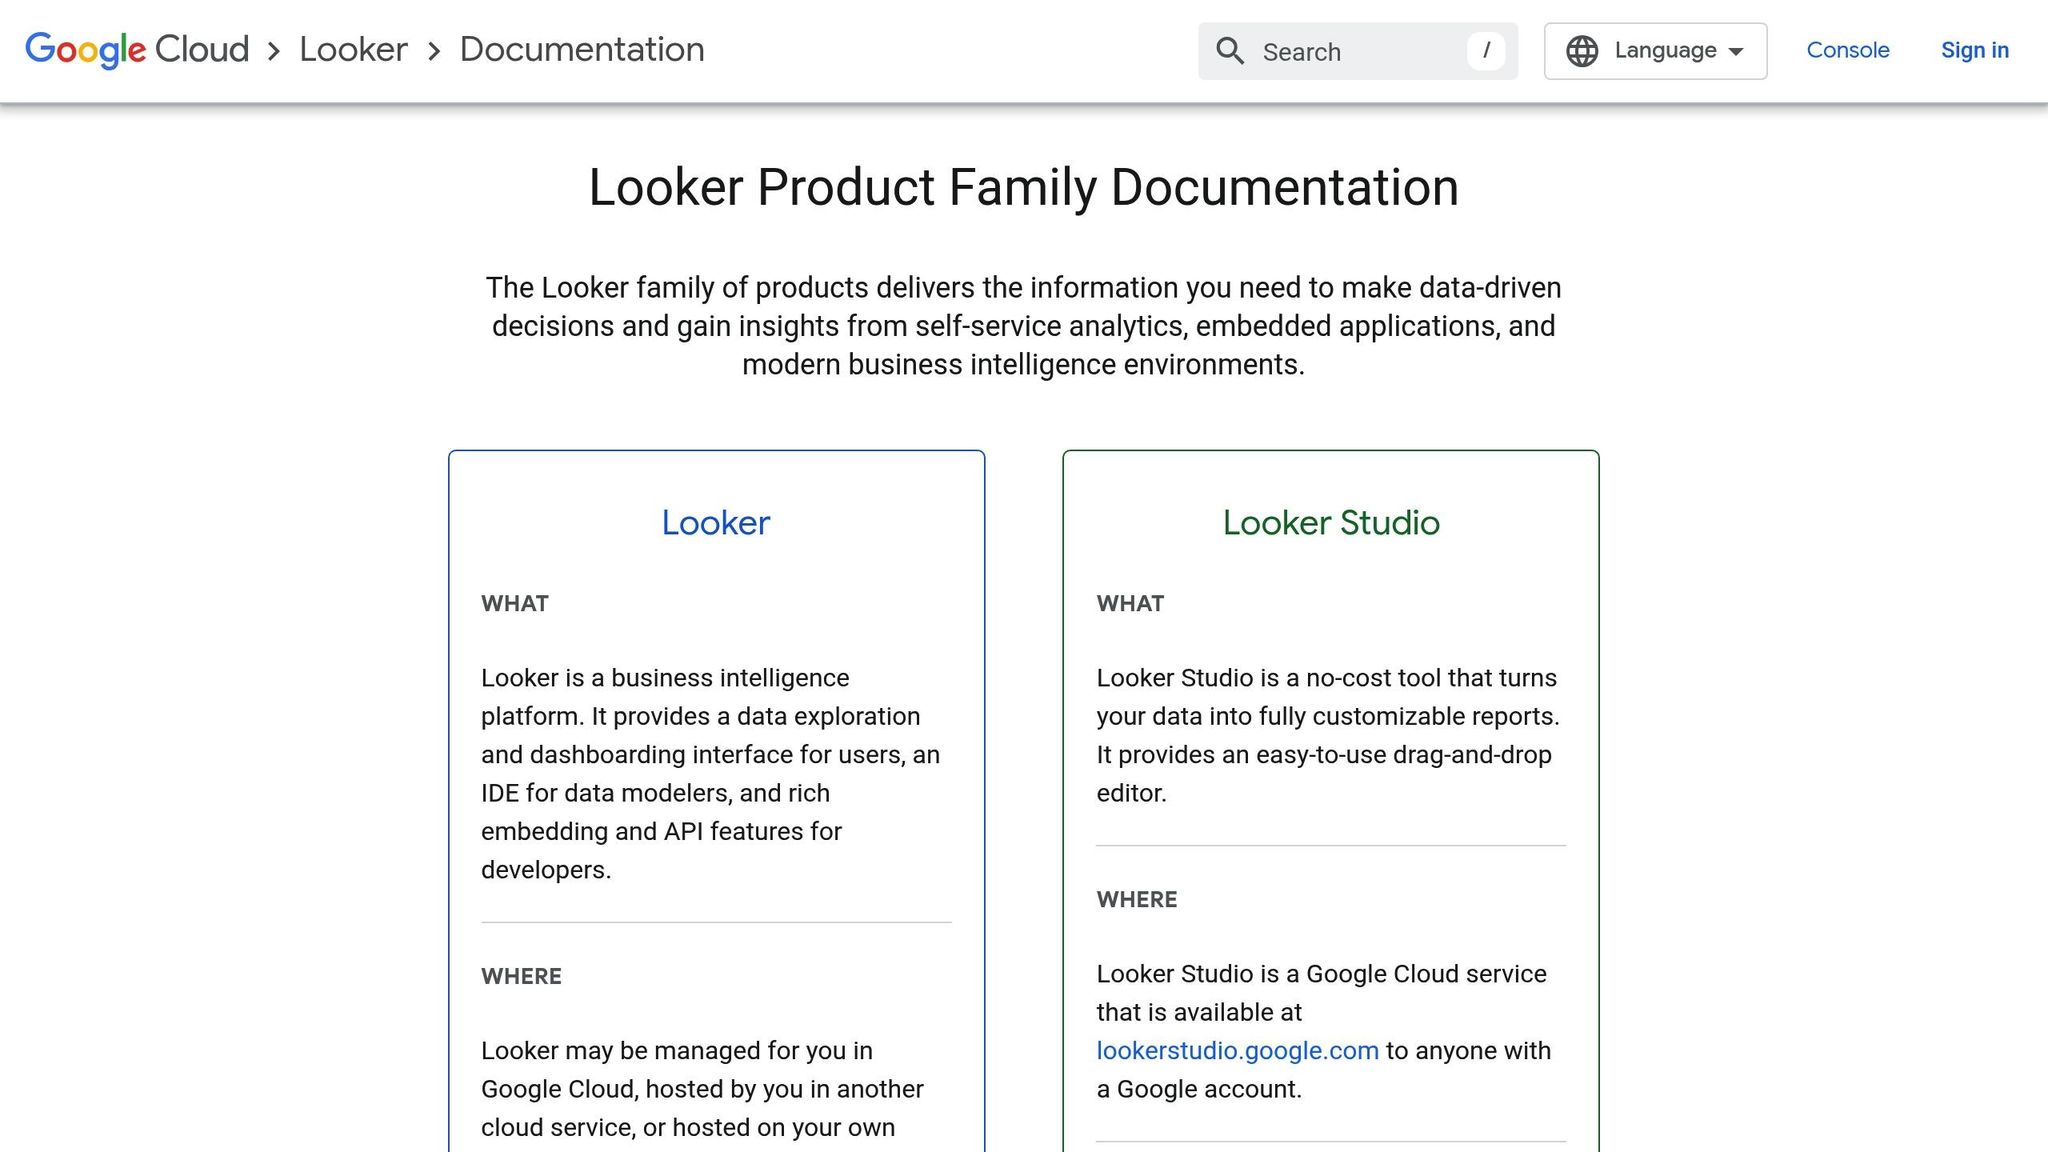
Looker stands out with its centralized approach to data modeling, powered by LookML. This feature simplifies SQL workflows, offering over 100 modeling patterns to make data management more efficient. It supports connections to more than 50 SQL databases, including Google BigQuery, Amazon Redshift, and Snowflake.
Pricing Overview (via AWS)
- Standard: $66,600 per year
- Enterprise: $132,000 per year
- Embed: $198,000 per year
- User Licenses: View-only ($400/year), Standard ($799/year), Developer/Admin ($1,665/year)
Looker also excels in data visualization, generating charts directly from source data. Options range from simple bar and pie charts to more advanced visuals like Sankey and sunburst diagrams. However, customization options can feel limited, making Looker a better fit for internal reporting needs.
Its Blocks and self-service BI tools provide prebuilt models and customizable snippets, enabling teams to create dashboards focused on key performance indicators (KPIs).
Up next, we'll compare Tableau, Power BI, and Looker side by side.
Direct Comparison
Here’s a quick look at entry costs and free options for 2025:
- Power BI: $10 per user/month; includes a free tier with limited features.
- Tableau: $70 per user/month for the Creator license; offers free access through Tableau Public.
- Looker: Pricing includes a custom platform fee plus user licenses; no free tier available.
These prices give insight into how each tool balances affordability, scalability, and usability.
Next, we’ll explore which platform suits businesses of different sizes to help you make the right choice.
Recommendations by Business Size
Choosing the right platform depends on your organization's size and data requirements. Here's a breakdown of suitable options:
Large Enterprises need tools that can manage extensive data and ensure strong governance. Tableau stands out with its VizQL-powered visualizations and enterprise-level security, making it a great fit for complex and regulated industries. (Check out Tableau's AI-driven Explain Data and Hyper engine in Section 1 for more details.)
Mid-sized Companies benefit from Tableau's scalable VizQL features and AI-driven Explain Data. Its established reputation and robust analytics capabilities are perfect for organizations looking to expand without diving into overwhelming complexity. (Refer to Scalability in Section 1.)
Small Businesses and Startups might find Power BI more fitting, thanks to its user-friendly dashboards and seamless integration with Microsoft tools. For teams already using Microsoft Office, this can streamline deployment and daily operations.
Individual Professionals and Freelancers should look for platforms with easy-to-use interfaces, built-in visualization templates, smooth data integration, and accessible training resources.
When deciding, prioritize tools that offer scalability, strong security, and reliable support to align with your business goals.

